Visualizing DeX Movements
The DEX ranking fluctuation is nothing new, and we’ve discussed it at length in some of our past articles, we all know how much the Top 10 rankings can change from a day-to-day perspective. Coinmarketcap is such a useful data platform, and their daily DEX rankings is something we check quite frequently. But we were a bit curious to see how it all mapped out over an extended period, not just from daily ranking snapshot, so we started tracking over the month of May to see what happened.
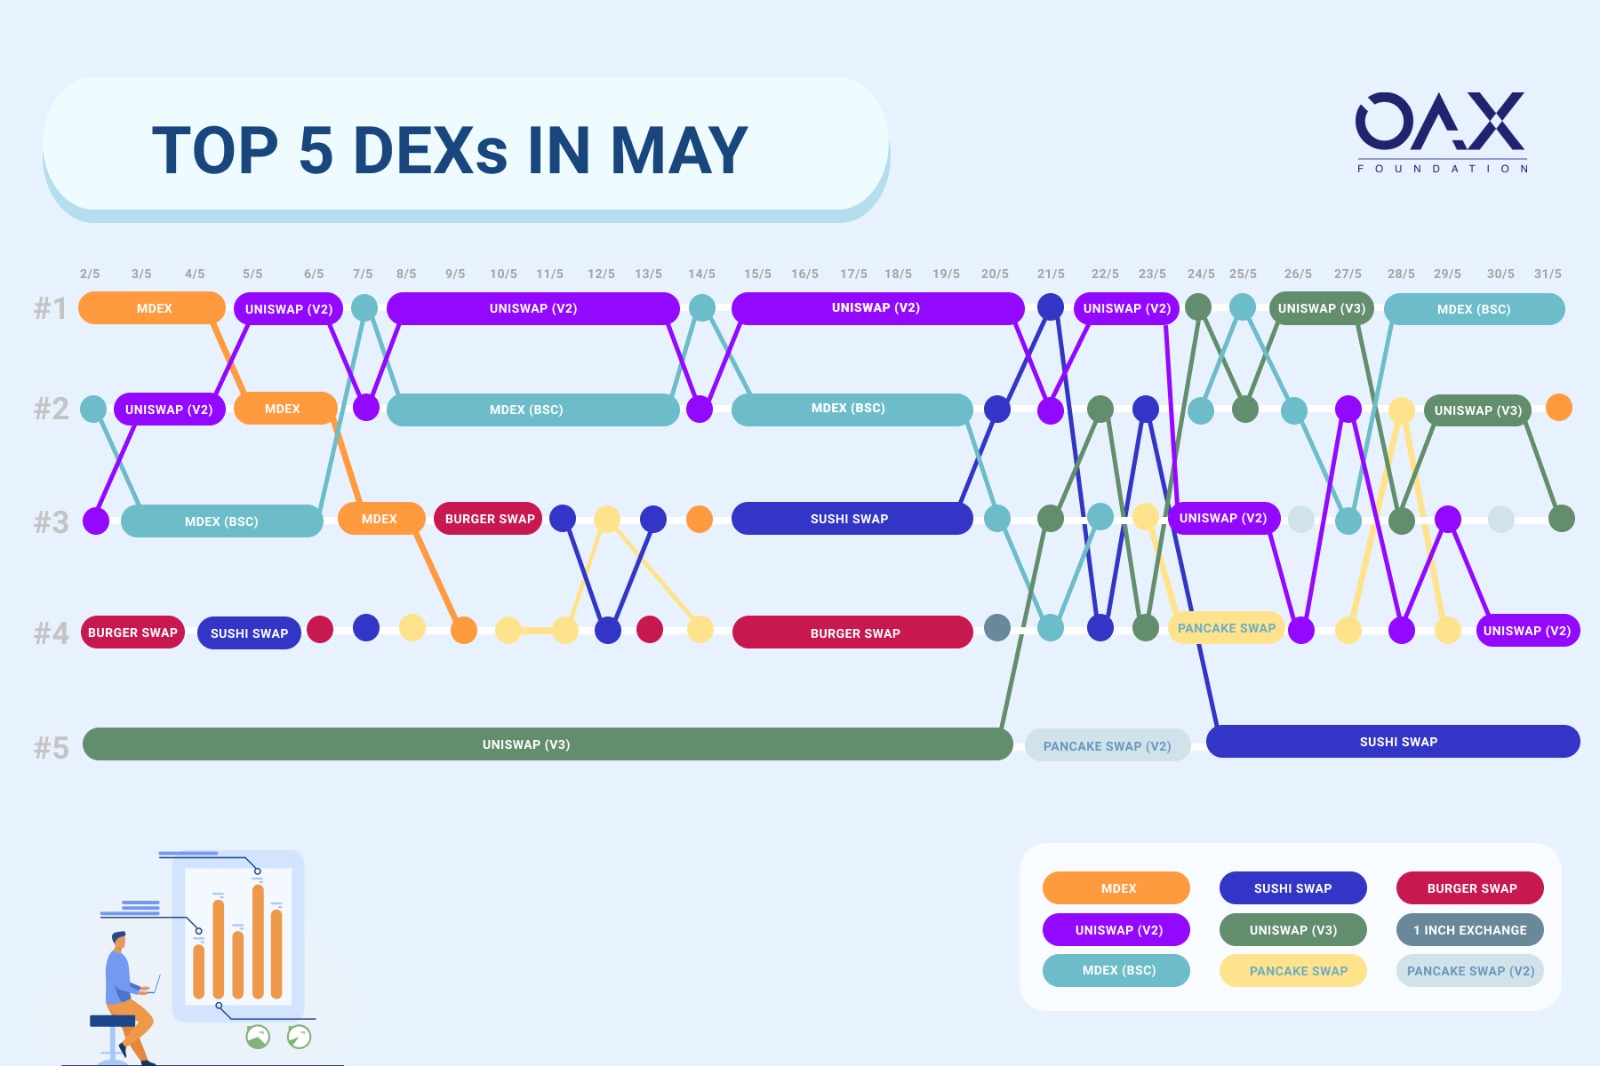 Source Data: Coinmarketcap
As expected the rankings do jump around with as much volatility as some of the tokens themselves, but it leaves us to wonder whether, when using DEXes, if there is something considered as platform (or exchange) loyalty? Without the need to sign up or tokens being hosted on a platform account, do users simply trade on different platforms day-to-day depending on the prices; and if that’s the case, shouldn’t aggregators perform best out of all of them?
But as we can see from rankings, that’s not always the case, so what attributes of a DEX appeals to users the most? While some may argue liquidity, and as valid as that point is, liquidity on some of these market leaders are unlikely to fluctuate as much as the rankings would show. Fees likewise don’t necessarily change so drastically on a day-to-day level. Or are there so many arbitrage opportunities within the different platforms that token holders are driving so much volume to different sites daily?
Share with us, how do you choose the DEX platform you trade on?
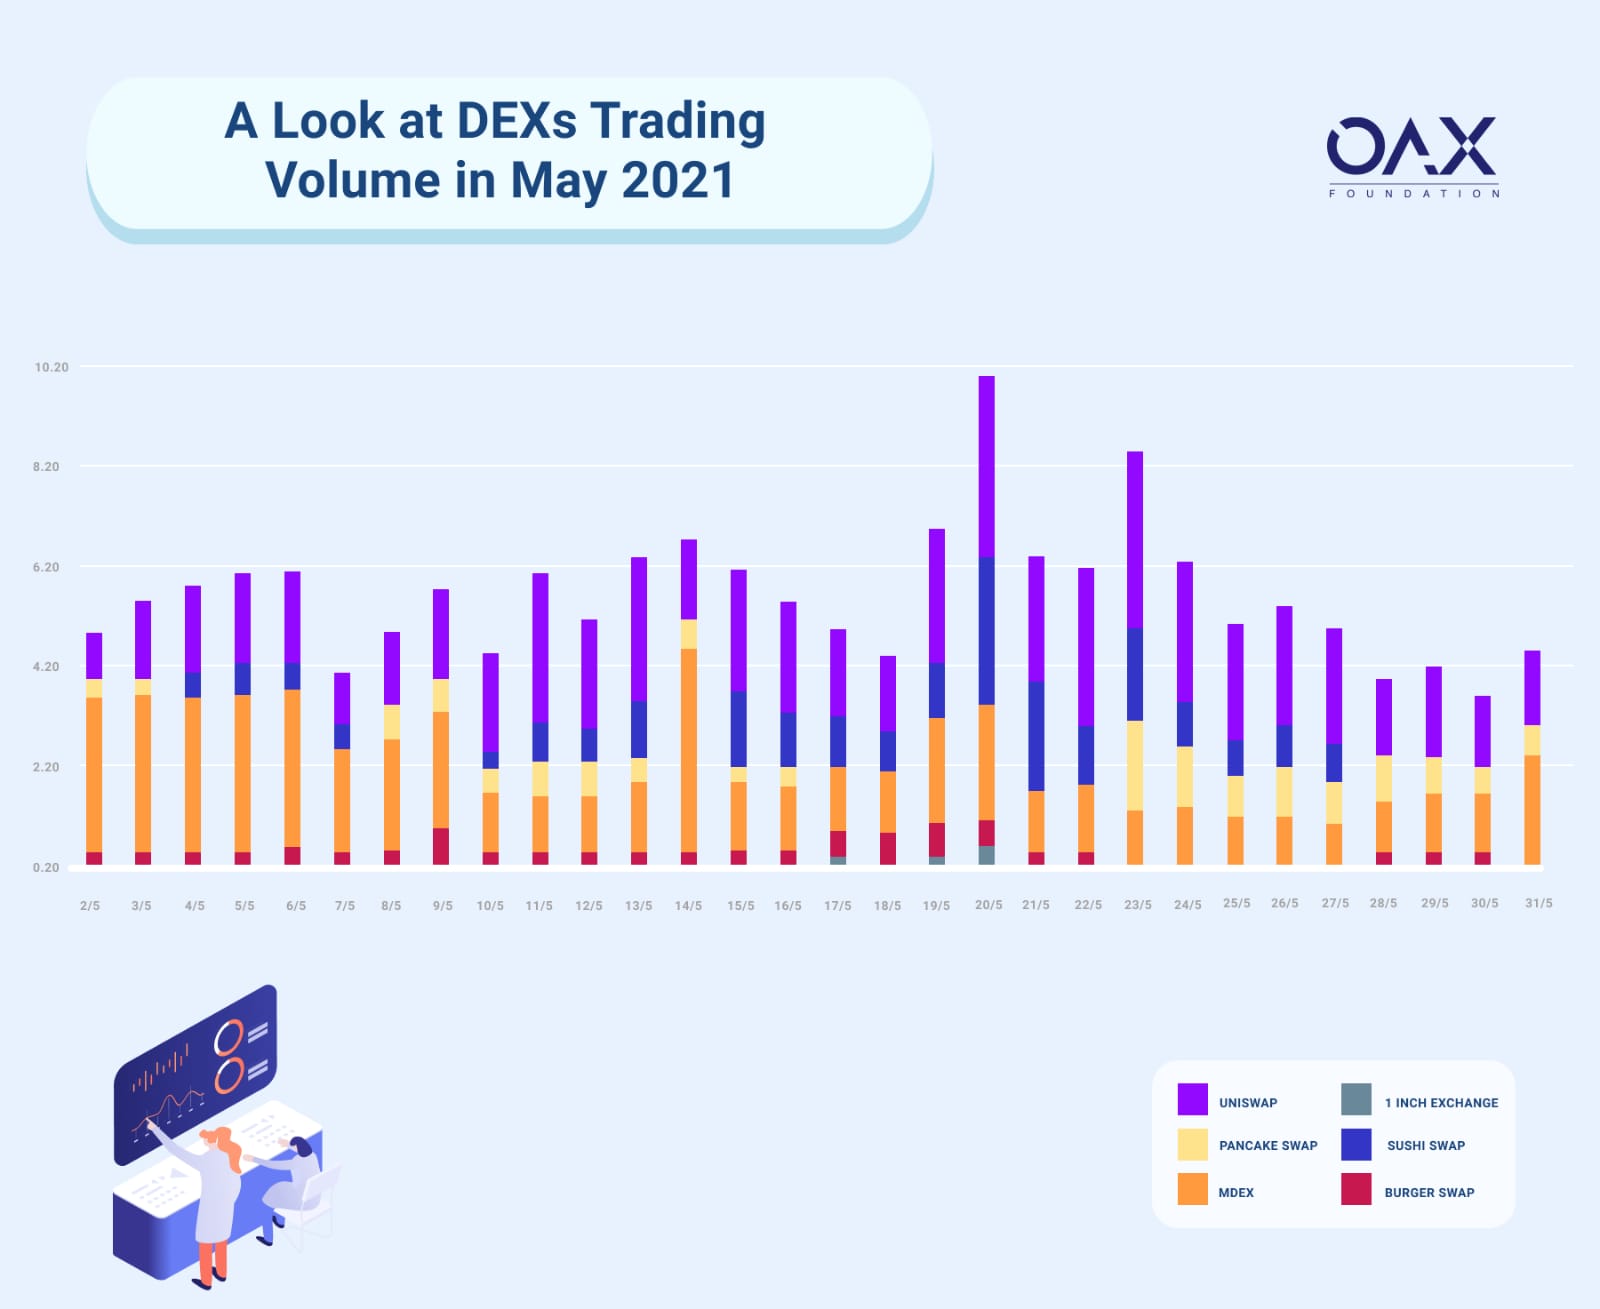 Source Data: Coinmarketcap